Statistics for Data Science — Basic Statistics
Statistics is a foundational component of data science, providing powerful tools and techniques for analyzing and interpreting data. Data scientists often use statistical techniques to extract meaningful insights from large and complex data sets and identify patterns and trends that can contribute to informed business decisions. With solid statistical understanding, a data scientist can better understand the behavior of the data.
In this blog series, we will cover everything from foundational theories to advanced analytical techniques and explore their real-world application. This series helps you to build a strong statistical understanding for data science.
What is Statistics?
Statistics is the branch of applied mathematics that deals with the collection, organization, analysis, interpretation, and presentation of data to help make more effective decisions.
Statistics is widely used in various fields such as science, economics, social sciences, business, and engineering to provide insights, make predictions, and guide decision-making processes. Statistics is like a tool that helps us see patterns, trends, and relationships in the data. Whether it’s counting how many people like pizza or figuring out the average score on a test, statistics helps us make decisions based on data.
Example:
- Average(mean) marks of students in an exam.
- Estimating the average height of all students in a school based on a sample of 100 students.
Why Statistics is important?
Imagine you’re the owner of an online bookshop. You have customer data. Now, you want to know how many books were sold in the last week, which books sold the most, and which customer purchased the most books.
Here’s where statistics comes in:
With statistics, you can analyze your customer data to uncover insights. You might discover that “Data Science for Beginners” is the bestselling book. These insights allow you to create effective marketing strategies for your business. For example, knowing which book is popular helps you focus your promotions on high-demand books, target specific customer groups, or even create personalized offers based on purchasing trends.
Some Key Concepts
Data: Data can be anything and everything . Any information or facts can be considered as data.
Example: age, weight etc.
Population: Population refers to the totality or collection of all objects, items or individuals on which observations are taken on the basics of a common characteristics.
Example: All students in a university when studying average exam scores.
Types of populations: The population can be classified based on the number of individuals it includes:
- Finite population: A finite population can be counted, and the members can be studied more easily. For example, the number of people enrolled in a course.
- Infinite population: A infinite population is so large that cannot be counted. For example, The number of user searches on Google per second.
Sample: A sample is a subset of population used to draw conclusions about the population.
Example: A survey of 100 students to understand the study habits of all students in the school.
Parameter: Parameters are numbers that describe the properties of entire populations.
Example: Average Height of All Students in a School — If the true average height of all students in a school is 5.5 feet, this value is a parameter.
Statistic: Statistic are numbers that describe the properties of entire sample.
Example: Average Height of 100 Students — If we measure 100 students from a school and find their average height is 5.4 feet, this is a statistic.
Variable: A variable is any characteristic, number, or quantity that can change or take different values in a dataset.
Example: age, length, height etc. that can be change or vary.
Types of Variable
According to weather a variable takes numerical of non-numerical values .It can be classified into two categories:
- Qualitative Variable
- Quantitative Variable
Qualitative Variable: Qualitative variables, also known as categorical variables, describe qualities or characteristics.
Example: Color of a car , Gender of a patient, Size of an industry etc.
Quantitative variable: Quantitative variables, also known as numerical variables, represent quantities or amounts.
Example: Number of children a family, Weight of a man etc.
Types of Quantitative Data
Discrete Data: Discrete variable can only take specific or distinct values. These values are typically whole numbers or integers and can be counted. Example: Number of students in a class (30, 31, 33 )
Continuous Data: Continuous variable is a type of variable that can take on any value within a given range and can be measured. Example: Height of a person.
Scale of Measurement
There are four types of scale as follows:
- Nominal Scale
- Ordinal Scale
- Interval Scale
- Ratio Scale
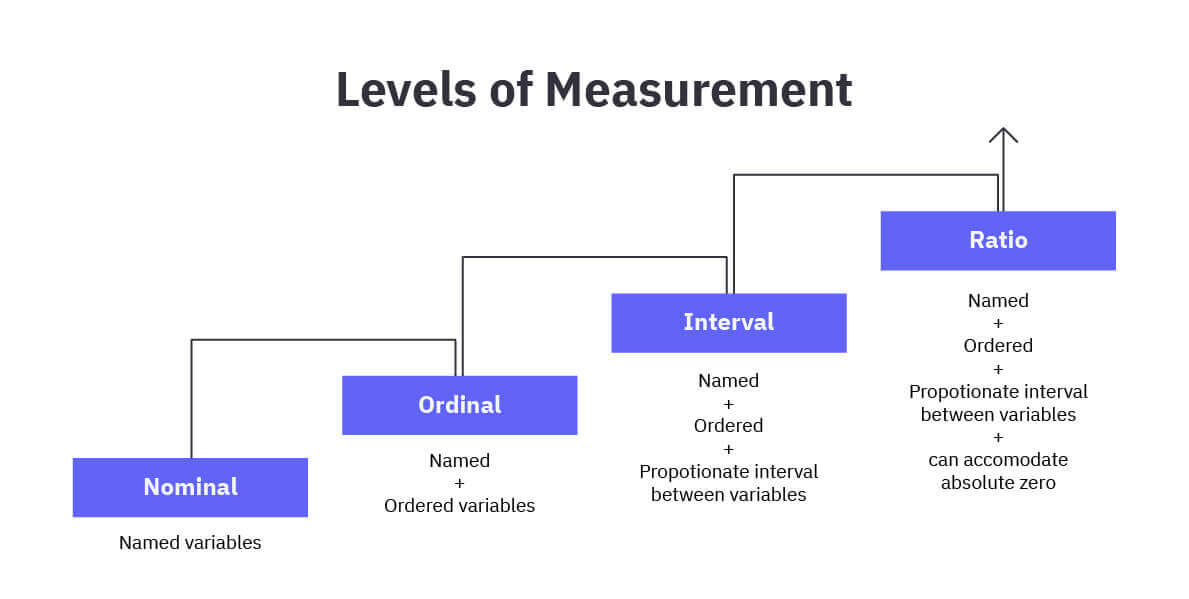
Nominal Scale: The nominal scale is the simplest form of measurement. It involves classify and identify a qualitative variable according to different categories of group .
Examples:
- Gender: Male, Female
- Blood Type: A, B, AB, O
- Marital Status: Single, Married, Divorced
Ordinal Scale: The ordinal scale is a type of measurement where data is organized into a specific order or ranking, but the differences between values are not measurable.
Examples:
- Education Level: High School, Bachelor’s Degree, Master’s Degree, PhD
- Customer Satisfaction: Very Unsatisfied, Unsatisfied, Neutral, Satisfied, Very Satisfied
- Economic Status: Low, Middle, High
Note: We cannot measure the exact difference between ranks. For example, “Satisfied” is higher than “Neutral,” but we don’t know by how much.
Interval Scale: The interval scale not only allows for ordering of data but also provides meaningful and equal intervals between data points. Interval scales do not have a true zero i.e In Celsius 0 degrees does not mean the absence of heat.
Examples:
- Temperature: Celsius, Fahrenheit
- Calendar Years: 2000, 2020, 2024
- IQ Scores
Interval data allows for addition and subtraction, but since there is no absolute zero, multiplication and division do not apply. For instance, 20°C is not “twice as warm” as 10°C.
Ratio Scale: The ratio scale is the most informative and robust scale of measurement. It has all the properties of the interval scale, but it also includes an absolute zero point, which allows for the calculation of ratios.
Examples:
- Height: 150 cm, 180 cm
- Weight: 50 kg, 100 kg
- Age: 20 years, 40 years
Types of statistics
There are two types of Statistics as follows:
- Descriptive Statistics.
- Inferential Statistics.
Descriptive Statistics
It is a method of describing and summarizing data in a meaningful way. They provide a way to present data in a meaningful and manageable form, helping you understand what the data shows at a glance.
Key Components of Descriptive Statistics:
Measures of Central Tendency: These are the values that represent the center or typical value of the data set.
- Mean (Average): The sum of all data points divided by the number of points.
- Median: The middle value in a data set when it’s ordered from least to greatest.
- Mode: The most frequently occurring value in the data set.
Measures of Dispersion (Variability): These metrics show how spread out the data is.
- Range: The difference between the highest and lowest values.
- Variance: A measure of how much the data points differ from the mean.
- Standard Deviation: The square root of the variance, showing how much data typically deviates from the mean.
- Frequency Distribution: This shows how often each value occurs in the data set. It can be represented through tables, histograms, or pie charts.
Inferential Statistics
It is a method of draw conclusions and making predictions about a population based on a sample of data.
Key Components of Inferential Statistics:
Hypothesis Testing: This involves making an assumption (the hypothesis) about a population parameter and then using sample data to test whether this assumption is likely true or false.
Null Hypothesis (H0): The hypothesis that there is no effect or difference.
Alternative Hypothesis (H1): The hypothesis that there is an effect or difference.
Confidence Intervals: These are ranges of values that are used to estimate a population parameter. For example, a 95% confidence interval means that you can be 95% certain that the true population parameter lies within this range.
Regression Analysis: This technique assesses the relationship between variables, allowing you to predict the value of one variable based on the value of another.
t-tests, chi-square tests, ANOVA (Analysis of Variance): These are different types of statistical tests used to compare groups and see if the differences between them are statistically significant.
Conclusion
In this blog, we’ve covered some basic but important concepts in statistics, like population, sample,parameters and scale of measurement. These ideas are essential for understanding how data is analyzed in data science.
In the next post, we’ll dive into descriptive statistics and learn how to summarize and understand datasets better.
Thanks for reading.