Statistics for Data Science — Measure of Central Tendency
Welcome to the new series — Statistics For Data Science. In this series, we will discuss the fundamental concepts of measures of central tendency and their real world application.
Descriptive statistics is a method of describing and summarizing data in a meaningful way. Measures of central tendency are one type of summary statistics used to understand data by providing a single value that represents the center of the dataset.
In this article, we will discuss about three key measures of central tendency: Mean, Median, and Mode. We will explain each one in detail and show you how to choose the best measure based on your data.
What Measure of Central Tendency?
Measures of central tendency are summary statistics that represent the center point or typical value of a dataset. It provides a single value that represents the center or average of a distribution. Central tendency helps to summarize and describe the main characteristics of a dataset, offering a single representative value.
Let’s imagine you have a CGPA for a whole class. Instead of looking at each CGPA individually, you can use central tendency to get an overall idea of how well the class performed. It helps you summarize big chunks of data into a single meaningful number.
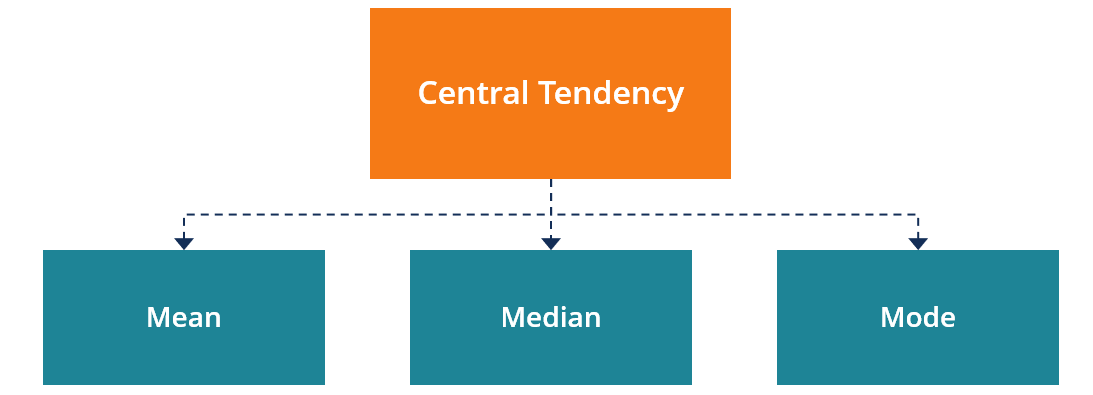
There are three main measures of central tendency:
- Mean
- Median
- Mode
Mean
The mean represents the average value of the dataset. It can be calculated as the sum of all the values in the dataset divided by the number of values. It is the most commonly used measure of central tendency .
Formula for Mean:
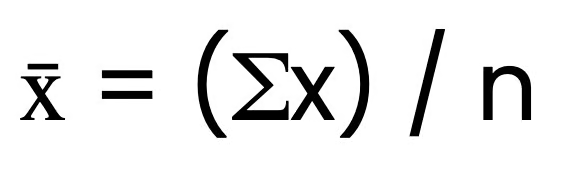
Where:
- ∑X is the sum of all values.
- n is the number of values.
Example: Consider a dataset with CGPA in a whole class. You want to find the average (mean) CGPA.
Dataset: {3.4,3.6,3.3,3.5,3.7,3.4,3.9,3.6}
- Add all CGPA = 28.4
- Count the number of CGPA = 8
- Divide the sum by the number of CGPA = 3.55
so, the average(mean) CGPA is 3.55
Median
Median is the middle value of the dataset in which the dataset is ordered in the ascending or in descending order. That means, it divides the whole ordered dataset into two equal parts. It is a measure of central tendency that represents the midpoint of a distribution.
Consider the given dataset with an odd numbers of observations ordered in descending order.
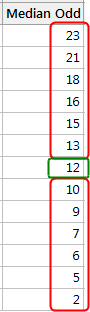
Here, 12 is the median value. Notice how the number 12 has six values above it and six below it. Therefore, 12 is the median of this dataset.
Consider another example with an even number of observations ordered in descending order.
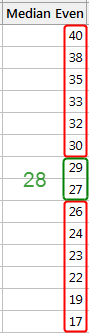
Here the given dataset two middle values obtained are 27 and 29. The mean of 27 and 29 is 28. Therefore, 28 is the median of this dataset.
Mode
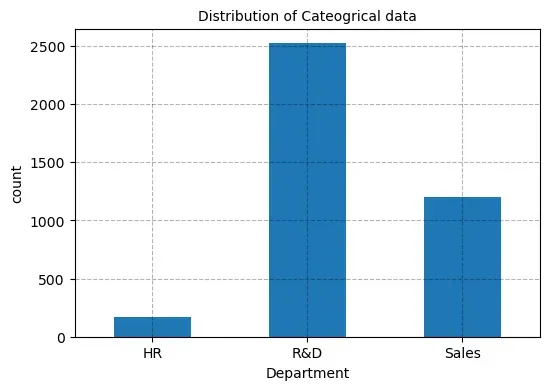
The mode is the value that appears most frequently in a dataset. While the mean and median are measures for continuous data, the mode is often used for categorical data but can also apply to numerical data.
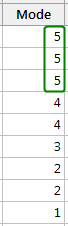
In the dataset below, the value 5 occurs most frequently, which makes it the mode.
Distributions and Central Tendency
A data set in central tendency is a distribution of n number of records or values. Distributions are basically of 2 types:
Normal Distribution:
In a normal distribution(symmetric distribution), information or data is symmetrically distributed with no skew. Most of the values cluster around a central area, with values decreasing off as they travel away from the center. The mean, mode and median are the same in a normal distribution.
.jpg)
Skewed Distributions:
In skewed distributions, most of the values lie on one side of the center rather than the other, and the mean, median and mode all vary from one another. The direction of this tail shows us the side of the skew.
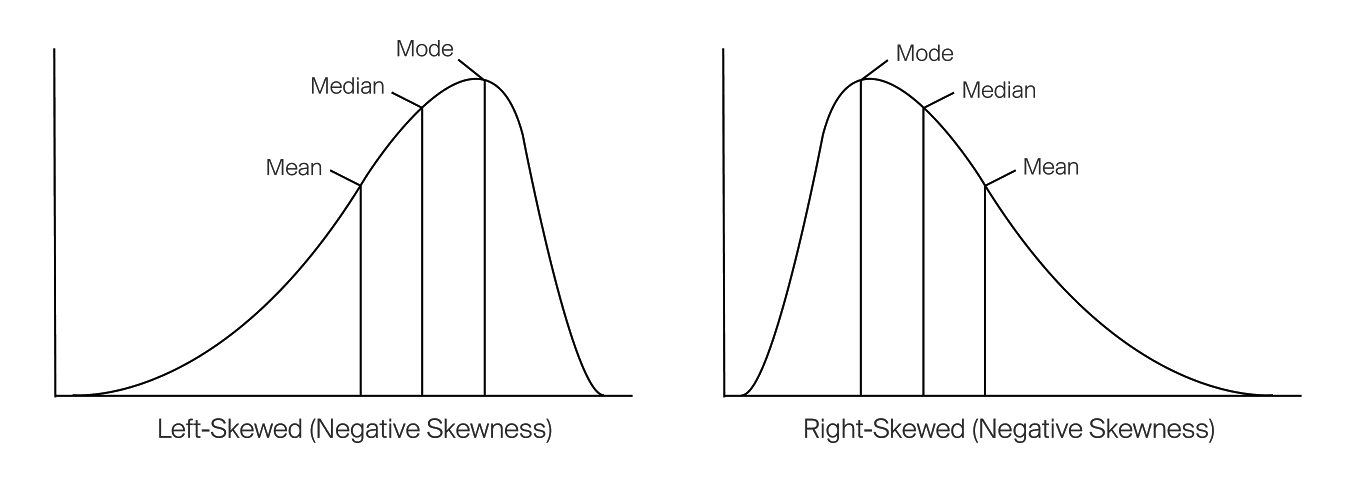
- If Right-skewed or positively skewed, the tail reaches out to the right.
Mode < Median < Mean
- Left-skewed or negatively skewed, the tail reaches out to the left.
- Mean < Median < Mode
Choosing the Right Measure
Selecting the appropriate measure of central tendency depends on your data’s characteristics and the insights you aim to extract. Here’s a straightforward guide to help you make the right choice:
- Mean: Use the mean when dealing with data that is continuous and normally distributed. It provides a good representation of the central value in such cases. However, the mean is sensitive to outliers, so it may not be suitable for datasets with extreme values. (First eliminate outliers and then use Mean if needed)
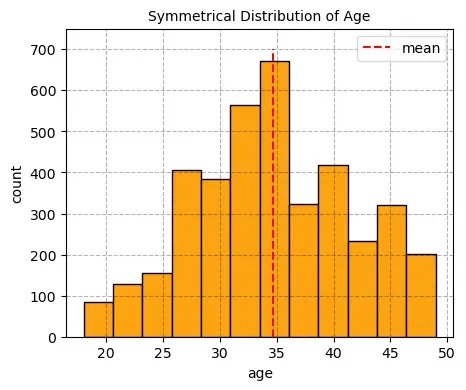
In a symmetric distribution, the mean locates the center accurately.
- Median: Use the median when your dataset contains outliers or has a skewed distribution. It is robust against extreme values and provides a better representation of the central value in such cases.
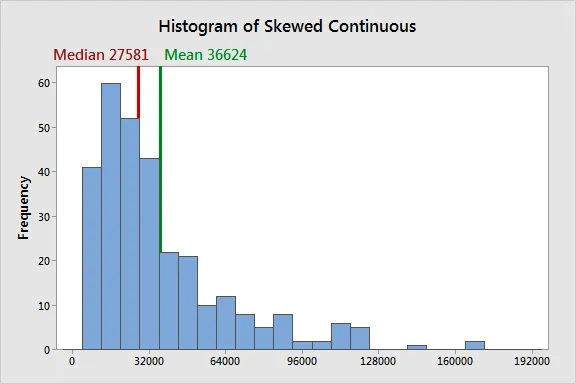
In a skewed distribution, the outliers in the tail pull the mean away from the center towards the longer tail. For this example, the mean vs median differs by over 9000. The median better represents the central tendency for the skewed distribution
- Mode: Use the mode for categorical data or when you want to identify the most frequent value in a dataset. For categorical data, the mode does not represent the central data; the mode is just the representation of the most common value present in the data.
What is the Best Measure of Central Tendency — the Mean, Median, or Mode?
In a symmetrical distribution of continuous data, the mean, median, and mode are all equal, making any of them suitable measures of central tendency. However, the mean is often recommended for normally distributed data because it takes into account every data point, providing a comprehensive measure.
In cases of skewed distribution, the median is generally preferred as it better represents the central tendency by mitigating the influence of outliers. For categorical data, the mode is the most appropriate measure, as it identifies the most frequently occurring category.
Thanks for Reading.